


The Australian population is rapidly ageing, and with an ever-growing number of seniors opting to age in place, home care and aged care services from providers such as The CareSide are now an essential part of day-to-day life for people across the country.
We aggregated the most reliable national data and home care statistics from recent years to help you understand the current home care landscape—and what it might look like in the future. From government reports to user trends, here’s a breakdown of the most important home care statistics in Australia in 2026.
Australia’s Ageing Population
Home care statistics in Australia reflect a simple truth: the country’s ageing population is driving a growing demand for home care and aged care services.
We’re seeing fewer babies being born than in previous generations, longer life expectancies, and fallout from ‘the baby boomer effect’, which saw a large population born post-World War II. All of those factors have swirled together to create a unique moment in history—a moment in which unpaid carers shoulder immense responsibility, and healthcare services such as telemedicine for seniors are essential.
Before we dive into Australia home care statistics, here are some key figures about the country’s population gathered over the past few years:
- More than 4.4 million Australians (17% of the population) are aged 65 and over. (Australian Institute of Health and Welfare [AIHW])
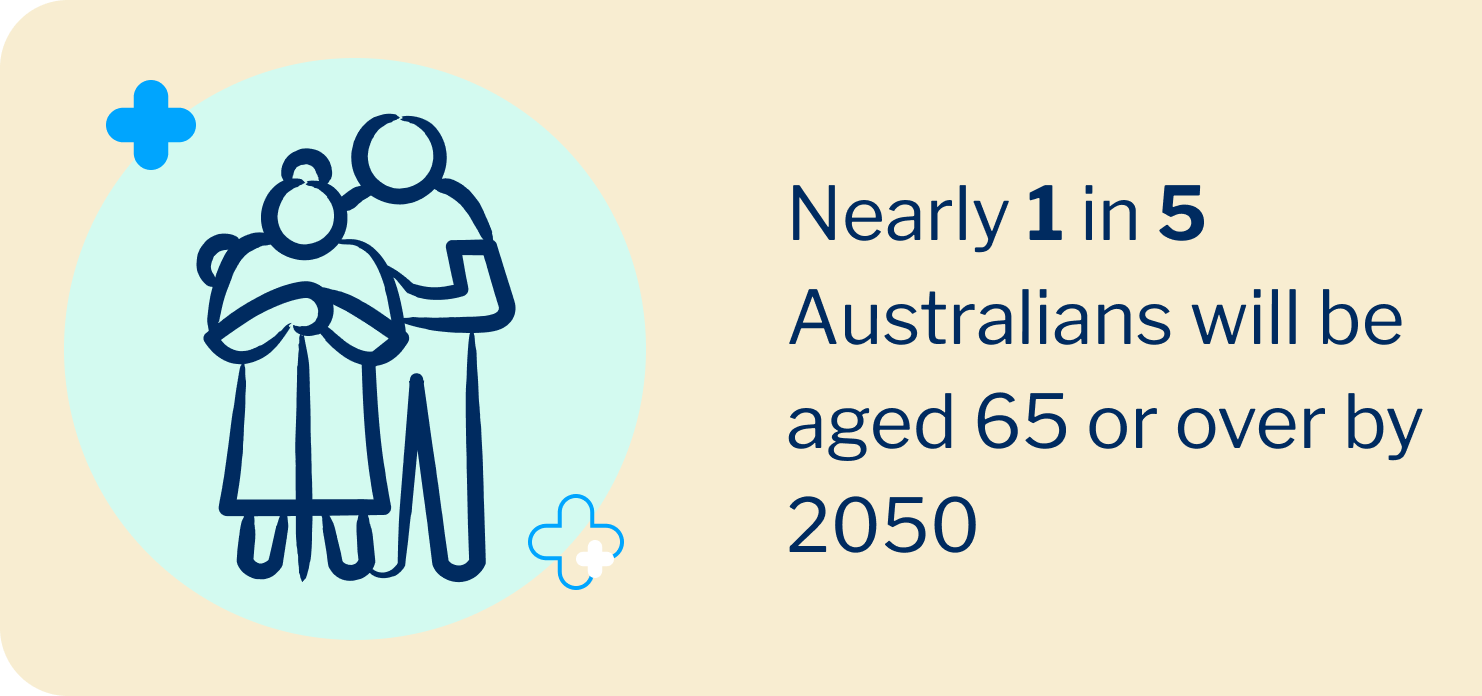
- By 2050, projections forecast that nearly 1 in 5 Australians will be in the over-65 age group. (AIHW)
- Given the choice, about 7 in 10 older Australians want to receive care in their own homes as they age. (The CareSide)
Home Care Usage in Australia
Now let’s take a closer look at some key home care statistics in Australia using data collated by the Report on Government Services (RoGS 2025) and the Aged Care Services data report 2025:
- Nearly 334,000 people had access to a Home Care Package (HCP) in 2024—more than a 6% increase from 2023.
- More than 829,000 people accessed support through the Commonwealth Home Support Programme (CHSP) in the 2024 period.
- Roughly 60% of HCP recipients were women in 2024-25. (Gen Aged Care Data)
- In 2024-25, 35% of home care admissions were aged 85 or older. Comparatively, this age group accounted for 54% of permanent residential aged care admissions. (Gen Aged Care Data)
- In 2025, more than 299,000 recipients were actively using their Home Care Packages, leading up to the transition to the Support at Home program on 1 November, 2025. (Home Care Packages Data Report)
- As of October 2025, 107,281 people were waiting in the National Priority System (NPS) for an HCP at their approved level leading up to the Support at Home transition on 1 November, 2025. (Home Care Packages Data Report)
- As of October 2025, there were 933 approved HCP providers (i.e., home care providers). (Home Care Packages Data Report)
Costs and Funding
Of course, costs are a critical part of home care statistics in Australia. Several key figures tell the story of Australia’s aged care system and how it’s evolved in recent years, particularly those tied to increases in government funding:
- In the 2024–25 Federal Budget, the Australian Government committed $2.2 billion to fund the aged care sector. (Department of Health and Aged Care, 2025)
- An additional 24,100 Home Care Packages were added to the system in 2024–25, totalling $531.4 million. (Department of Health and Aged Care, 2025)
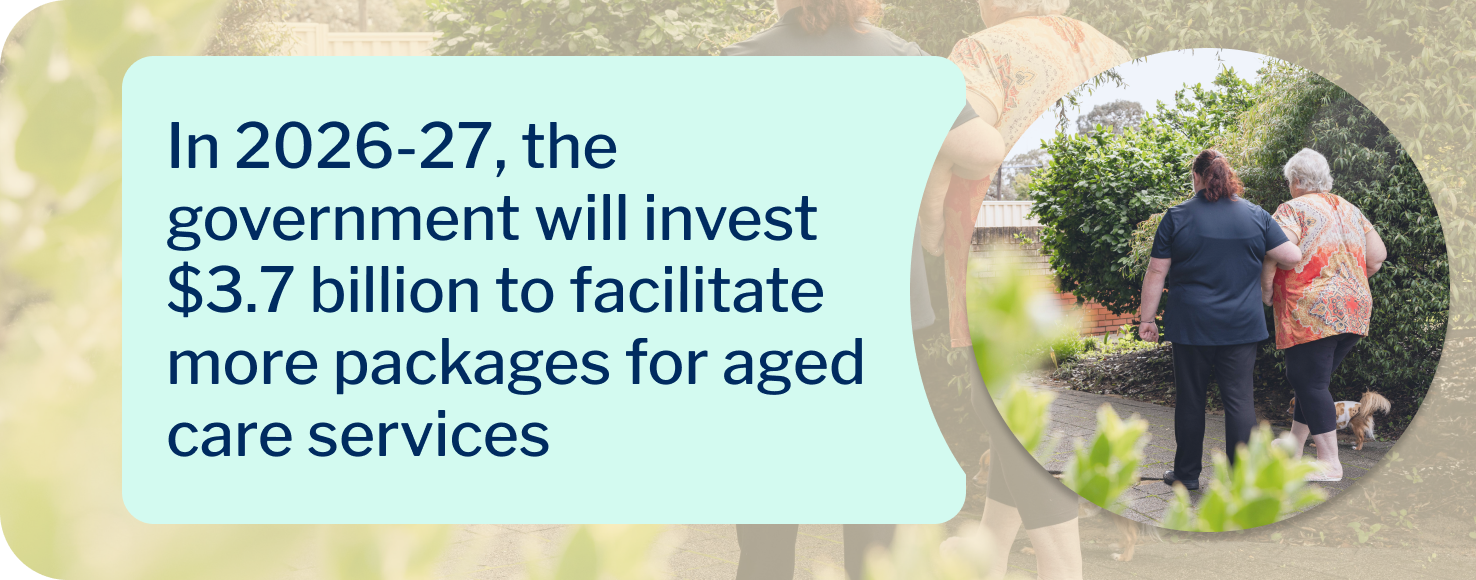
- In 2026-27, the government will invest $3.7 billion to facilitate more packages for aged care services, among other deliverables (such as beds, faster access to Support at Home, and an expanded End-of-Life pathway to provide more care for palliative patients). (Department of Health and Aged Care, 2026)
Home Care Workforce Statistics
Australia’s aged care workforce has also experienced a surge in the past few years, as more aged care providers enter the market and the sector expands to meet growing care needs.
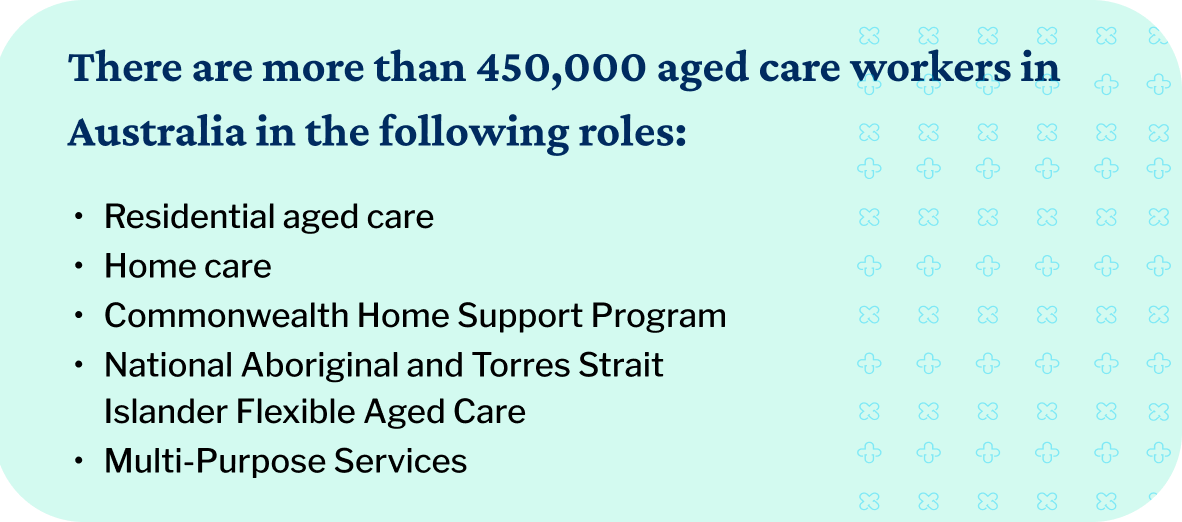
- There are approximately 450,000 aged care workers across Australia. (Department of Health and Aged Care)
- More than 70% of those workers are employed in direct care roles. (Department of Health and Aged Care)
- In the Home Care Package Program space, most of the training delivered to personal care staff in the past couple of years covered infection prevention and control, code of conduct, workforce health and safety, COVID-19 and elder abuse. (Department of Health and Aged Care)
- The total number of staff in the Home Care Package program increased from 80,340 in 2020 to 170,000 in 2023. (Department of Health and Aged Care)
- Women make up more than 80% of the workforce. (Gen Aged Care Data)
- As of October 2025, more than 3 million unpaid carers supplement the formal aged care system, with nearly 400,000 of those serving as primary carers for people aged 65 and over. (AIHW)
Wait Times and Service Gaps
In the wake of 2025’s aged care reforms, wait times for home care remain a challenge during the Support at Home era, and Australia home care statistics reflect that.
As of 2026, the average wait times for each level of care (according to My Aged Care) are as follows:
- Urgent priority: Within one month
- High priority: 1 to 2 months
- Medium priority: 6 to 7 months
- Standard priority: 7 to 8 months
As of March 2026, more than 360,000 people had an ongoing Support at Home place (they were either in care or considering the offer), and 100,191 people were waiting for an ongoing Support at Home place.
The government’s most recent wait times report also shows wait times can vary drastically by location. Victoria currently has the shortest median wait at 273 days, while Queensland has the longest median wait at 322 days.
Market Trends in Home Care
Service providers play a vital role in the home care landscape: they deliver health services tailored to help people achieve their goals in older age, especially remaining independent. Let’s explore Australia’s home care statistics surrounding private and not-for-profit providers:
- In 2025, not-for-profit organisations operated around 64% of home care services and 71% of home support outlets. (Gen Aged Care Data)
- Private organisations came in second, with 30% of home care services and 12% of home support outlets. (Gen Aged Care Data)
- Government organisations operated the fewest number of home care (6%) services, but almost one-fifth of home support outlets (17%). (Gen Aged Care Data)
- Nearly 60% of support services were located in metropolitan areas, while 33% were located in rural towns and remote communities. (Gen Aged Care Data)
Need more home care stats?
If you’d like to gather your own insights or dig deeper into home care statistics in Australia, The CareSide recommends these sources:
- GEN Aged Care Data – Government-provided aged care statistics
- Department of Health and Aged Care – Policy updates, budget allocations, and care program data
- Aged Care Quality and Safety Commission – Reports on complaints, standards, and assessments
- Productivity Commission Reports – Analysis on long-term care trends and funding
- Australian Bureau of Statistics (ABS) – Population data and demographic trends
- National Seniors Australia – Advocacy and research into preferences of older Australians
Why does this page matter?
Many writers, researchers, and marketers reference home care statistics in their work—but they don’t always link to original sources. A well-organised, consistently updated page like this can be handy as a quick, easy-to-scan resource. Be sure to bookmark and share this post as a go-to reference.